. 2017 Oct 27;16:1177–1187. doi: 10.17179/excli2017-738

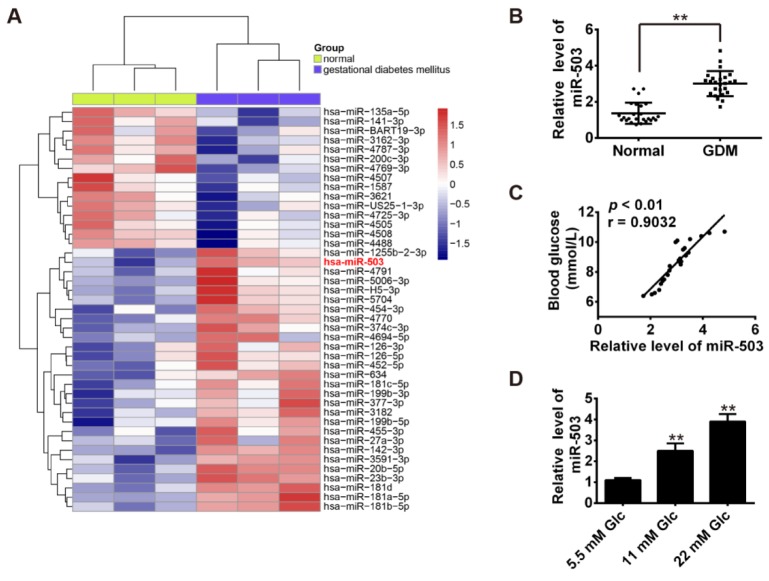
Figure 1. miR-503 is upregulated in GDM and its expression is positively correlated with blood glucose concentration. A. Heatmap of normalized expression levels of miRNAs in placenta tissues from 3 pairs of GDM pregnancies and healthy pregnancies. B. qRT-PCR was performed to determine the expression levels of miR-503 in peripheral blood samples from 25 pairs of GDM pregnancies and healthy pregnancies. **p < 0.01 vs. Normal group. C. Correlation between miR-503 level and blood glucose determined by Spearman correlation analysis (r = 0.9032, p < 0.01). D. qRT-PCR was performed to determine the expression levels of miR-503 in INS-1 cells maintained for 4 days with different glucose concentrations (5.5 mM, 11 mM and 22 mM). 5.5 mM glucose acts as an internal control. Data represent the mean ± SD of three independent experiments. **p < 0.01 compared with 5.5mM Glc group.

Figure 1