. 2017 May 11;7(40):24730–24735. doi: 10.1039/c7ra03969g

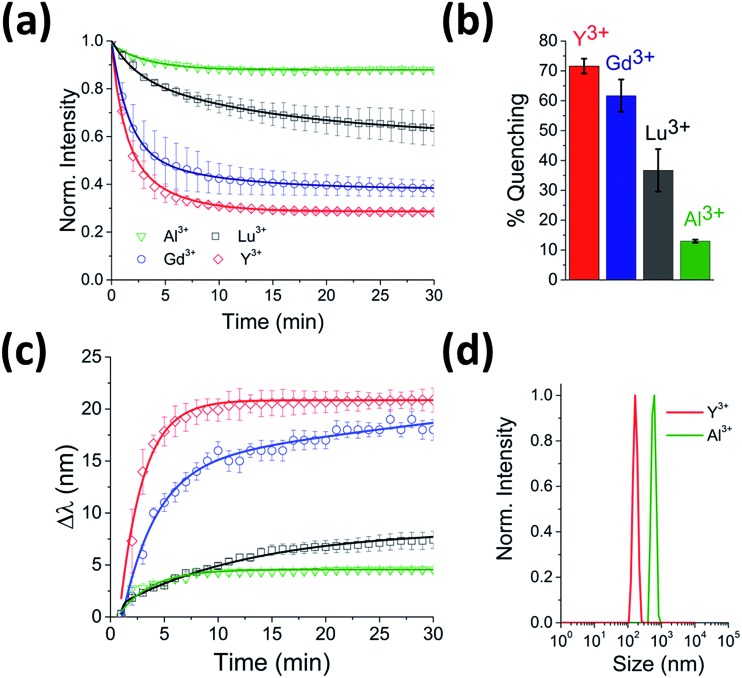
Fig. 3. Real-time probing of CdTe 580 QD aggregation induced by Y3+, Lu3+ and Al3+. (a) Representative fluorescence quenching trajectories of 25 nM CdTe 580 QDs induced to aggregate over 30 minutes by addition of 10 μM Y3+ (red), 10 μM Lu3+ (black) and 10 μM Al3+ (green) at pH 8. For comparison, the 10 μM Gd3+ (blue) from Fig. 1d is also shown. (b) Comparative bar plot summarizing the relative variations in fluorescence quenching observed at t = 30 minutes. (c) The corresponding red-shifts in emission spectra (λ exc = 400 nm) across the 30 minute time window are shown. (d) DLS size distributions of CdTe 580 QDs after injection (t = 30 min) of 10 μM Y3+ (red) and 10 μM Al3+ (green).

Fig. 3