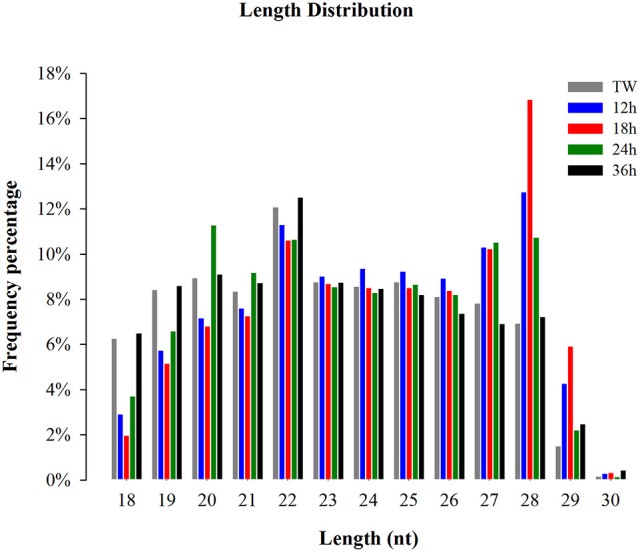
Figure 1.

Size distribution of small RNA reads in the libraries of Plutella xylostella. Different colors represent different libraries. X-axis represents small RNA length distribution and Y-axis represents frequency percentage. Tween (TW) was used as a control.
