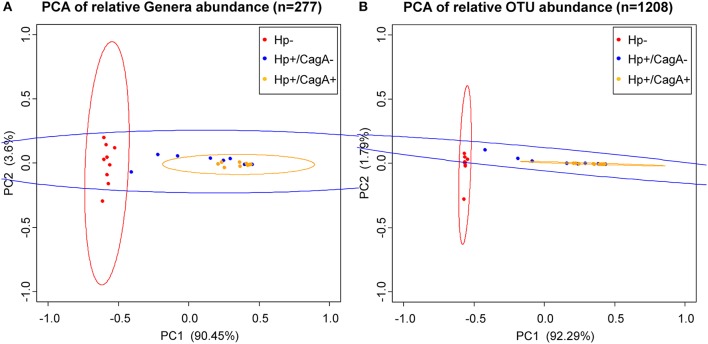
Figure 2.
Principal Component Analysis (PCA) ordination plots of relative abundance of genera (A) and OTUs (B). Statistically significant differences were found between H.p.− and the H.p.+/CagA− (adj. p-value OTU = 0.000001, adj. p-value genera = 0.000001) as well as between the H.p.− and the H.p.+/CagA+ groups (adj. p-value OTU = 0.000009, adj. p-value genera = 0.000023). No statistically significant differences were found between H.p.+/CagA− vs. H.p.+/CagA+ sample groups (adj. p-value OTU = 0.236619, adj. p-value genera = 0.095089). Ellipses denote the 95% confidence.

