
Figure 3.
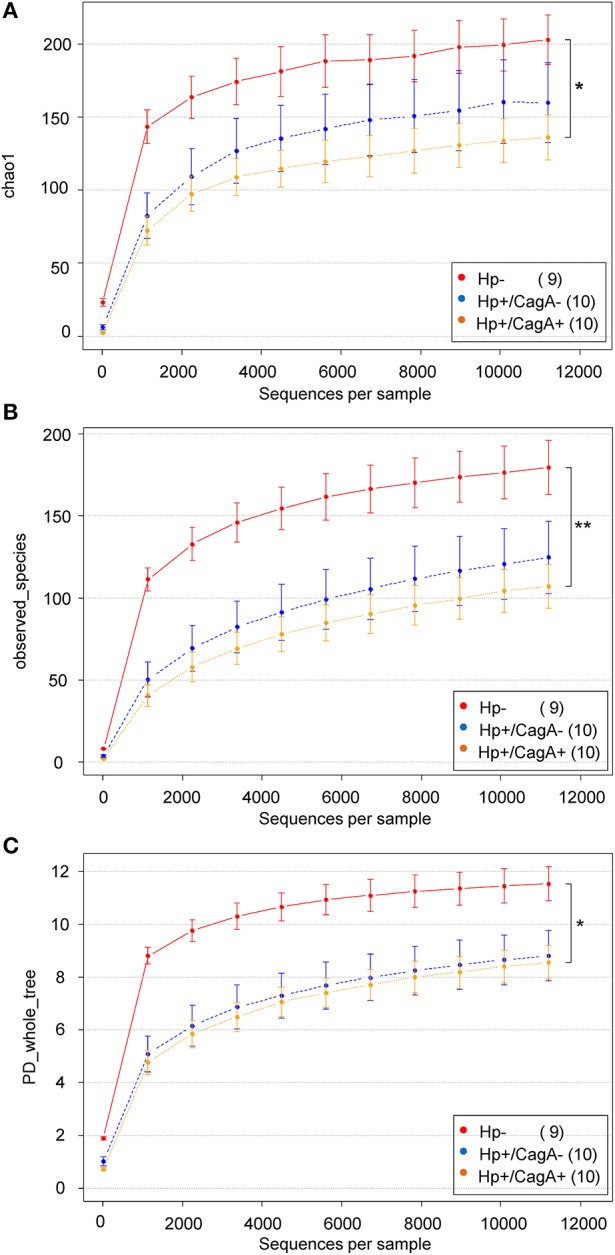
(A) Chao1, (B) PD-wholetree, and (C) observed species rarefied alpha diversity of the three sample groups (H.p.−, H.p.+/CagA−, H.p.+/CagA+). A significant difference was found between the H.p. negative and the H.p.+/CagA+ groups with a not significant intermediate phenotype of the H.p.+/CagA− group. Error bars denote standard error.