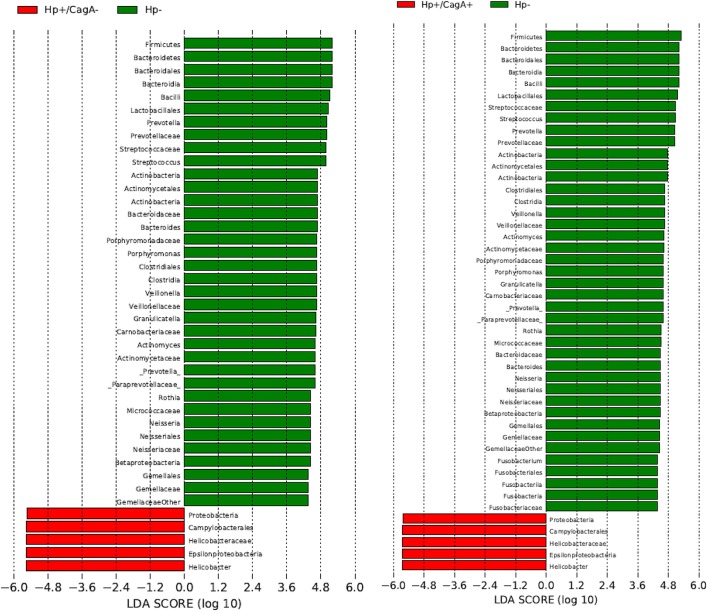
Figure 5.
Linear discriminant Effect Size analysis (LefSe) analysis revealed over 40 taxa (H.p.− vs. H.p.+/CagA+ 45, H.p.− vs. H.p.+/CagA− 41) significantly different in their relative abundances between the sample groups in the pairwise comparisons H.p.− vs. H.p.+/CagA+, H.p.− vs. H.p.+/CagA− and H.p.+/CagA− vs. H.p.+/CagA+. Only taxa with a relative abundance of at least 1% in at least 50% of all samples out of one sample group were considered.

