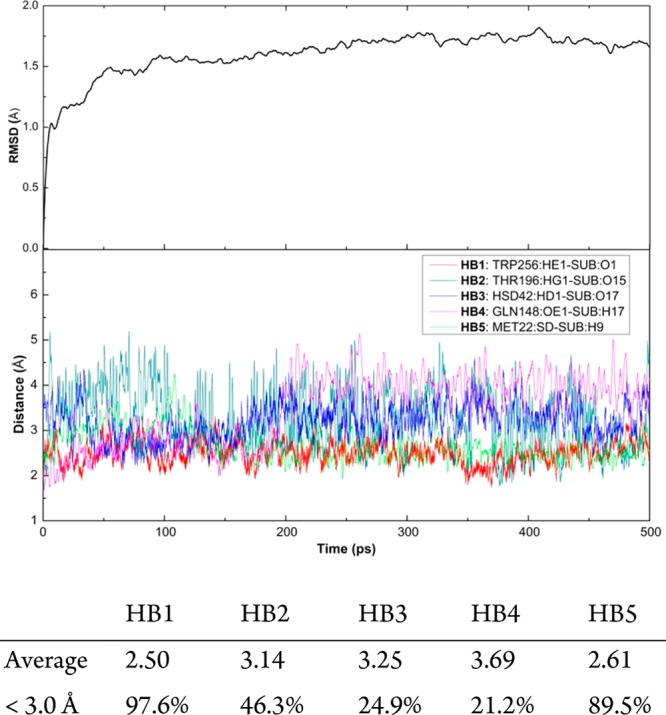
Figure 5.

RMSD for the whole system (top) and five selected hydrogen bond distances between SpnF and substrate (bottom) during a 500 ps classical MD simulation. Listed below the figure are the average hydrogen bond distances and the percentages of hydrogen bonds shorter than 3.0 Å after 100 ps.
