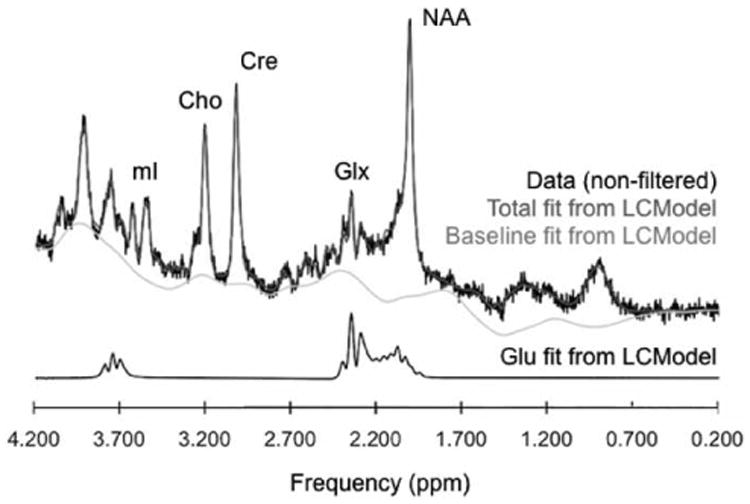
Figure 1.

Representative proton magnetic resonance spectrum of the anterior cingulate cortex at 4 Tesla collected at TE=30ms with a point-resolved spectroscopy sequence along with spectra of Glu. The real part of the frequency-domain data (phased and referenced FFT of raw input data with no smoothing) is plotted as the black curve. The red curve is the LCModel fit to this data. Also plotted as the gray curve is the baseline. Below is the fiting line for Glu only. Cho = Choline; Cr = Creatine; Glx = Glutamine + Glutamate; Glu = Glutamate; NAA = N-Acetyl Aspartate; mI = myo-inositol; ppm = parts per million.
