
Figure 3.
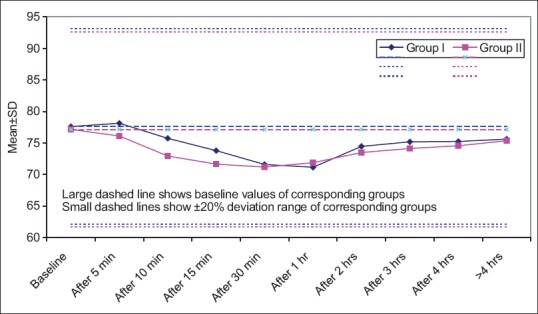
With regard to diastolic blood pressure, Group I had higher mean values as compared to Group II, at all the time intervals except at 1 h. However, at none of the time intervals during the study, the difference between two groups was statistically significant (P > 0.05)