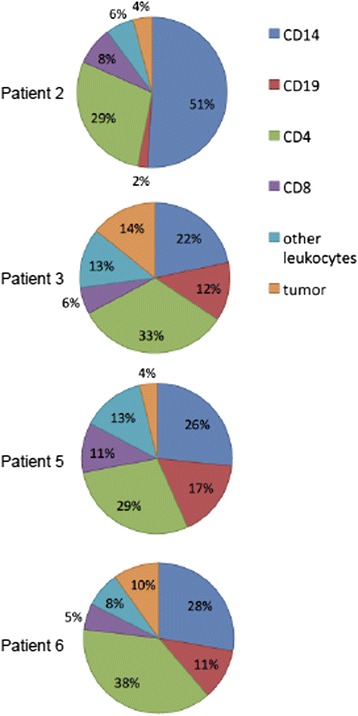
Fig. 4.

The immune cells contained in the pleural effusion were examined by flow cytometry. Phenotype was determined by staining with anti-CD45 and lineage-specific markers. Tumor cells were identified by light scatter characteristics and defined as live cells without the CD45 and lineage-specific markers. Pie charts depict percentages of live cells detected in pleural effusions for each of the patients. Phenotypes represented are CD14+ monocytes (blue), CD19+ B cells (red), CD4+ T cells (green), CD8+ T cells (purple), other leukocytes (light blue) and tumor cells (tan)
