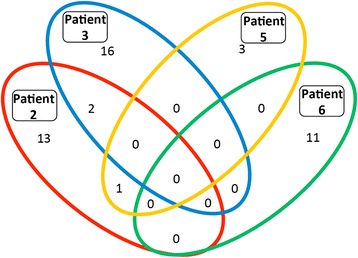
Fig. 6.

Increased antibody responses after vaccination. Serum from pre-treatment and day 71 (patients 2, 3 and 5) or day 43 (patient 6) was assessed for antibody responses against 9,000 human proteins. After data filtering, the number of antibodies with a greater than 5 -fold increase (with a minimum RFU value > 1000 post vaccination) for each patient were calculated and presented above in a Venn diagram, with shared humoral responses represented within overlapping sections
