
Fig. 1.
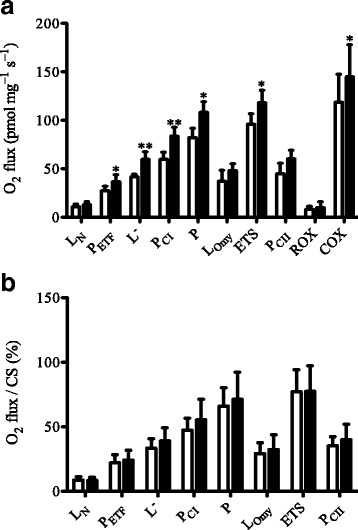
Mass-specific mitochondrial (a) and mitochondrial-specific (b) respiratory capacity (normalized to citrate synthase). Respiratory capacities are presented for Huntington disease patients (n = 6) before training (white bars) and after the training intervention (black bars). LN, leak respiration without adenylates; PETF, fatty acid oxidative capacity; PCI, respiratory capacity of complex I; P, oxidative phosphorylation capacity; LOmy, oligomycin-induced leak respiration; ETS, electron transport system capacity; PCII, respiratory capacity of complex II; ROX, residual oxygen consumption; COX, respiratory capacity of complex IV. Values are mean ± SD. *P < 0.05; **P < 0.01, significant differences between pre-training and post-training