Fig. 1.

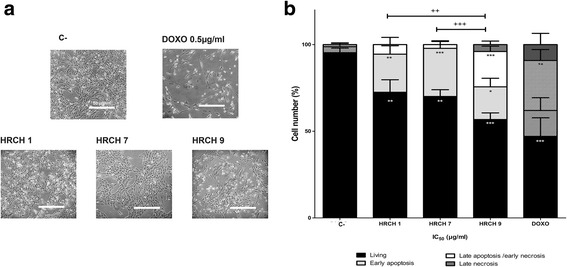
HRCH modulated morphological changes and induced apoptosis on D384 cells. a D384 cells were treated with control (C-), doxurrubicin (0.5 μM), HRCH 1 (74 μg·mL−1), HRCH 7 (71 μg·mL−1), and HRCH 9 (41 μg·mL−1) for 48 h. These were visualized under a microscope and imaged. Magnification: 40X. b Fraction of viable, apoptotic, and necrotic D384 cells treated with IC50 of HRCH for 48 h. Data are presented as mean ± SEM, n = 6. Data were analyzed by repeated ANOVA followed by Bonferroni post-test. Symbols denote statistically significant differences: * p < 0.01, ** p < 0.001 and *** p < 0.0001 with respect to C-; + p < 0.01, ++ p < 0.001 and +++ p < 0.0001 between HRCHs
