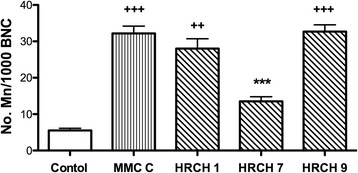
Fig. 4.

Anti-genotoxic activity on CHO-K1 cells exposed to HRCHs post-treatment with MMC. The number of Mn for 1000 BNC exposed to 1 mM MMC and 1000 μg·mL−1 HRCHs for 3 h. Data are presented as mean ± SEM, n = 6. Data were analyzed by repeated ANOVA followed by Bonferroni post-test. Symbols denote statistically significant differences: +++ p < 0.0001 with respect to control (C-) and *** p < 0.0001 with respect to MMC and between HRCHs
