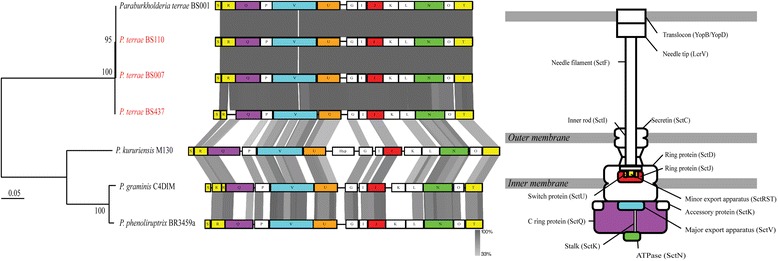
Fig. 6.

Synteny comparison of Hpr-2 type-3 secretion systems (T3SS) used in the phylogenetic tree. Evolutionary distance was computed with MEGA7 using a maximum-likelihood method. The bootstrap values above 50% (from 1000 replicates) are indicated at the nodes. The tree was generated based on alignment of eight conserved genes of the T3SS (SctS, SctR, SctQ, SctV, SctU, SctJ, SctN, and SctT) indicated by the colored boxes. The letter in the boxes indicates the last letter of the Sct gene. Comparison percentage was generated using BLAST+ 2.4.0 (tBLASTx with cutoff value 10−3) and map comparison figures were created with the Easyfig program [33]
