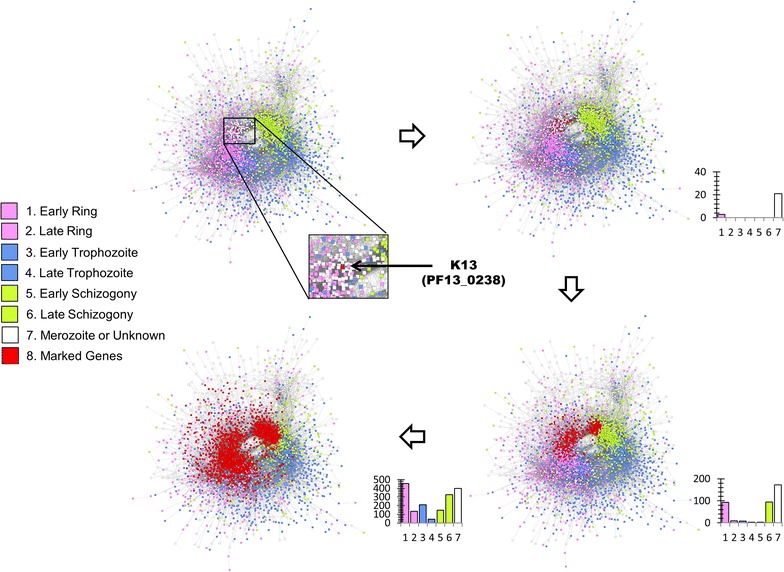
Fig. 2.

Flowchart showing the neighboring genes of the k13 gene in co-expression based interaction network. The P. falciparum gene–gene interaction network based on co-expression data is recovered from STRING v10 [32]. The unconnected nodes are not considered in this analysis. The force directed layout is used to plot the network. The genes are colored according to the maximum expression stage data [34] recovered from PlasmoDB [30]. The genes highlighted in “red” color, are the first, second and third neighbor genes of the k13 gene, shown using four networks in clockwise orientation. The neighbor genes are marked using Cytoscape v3.2.1. The barplot with each network represents the number of genes expressed in each stage per diffusion
