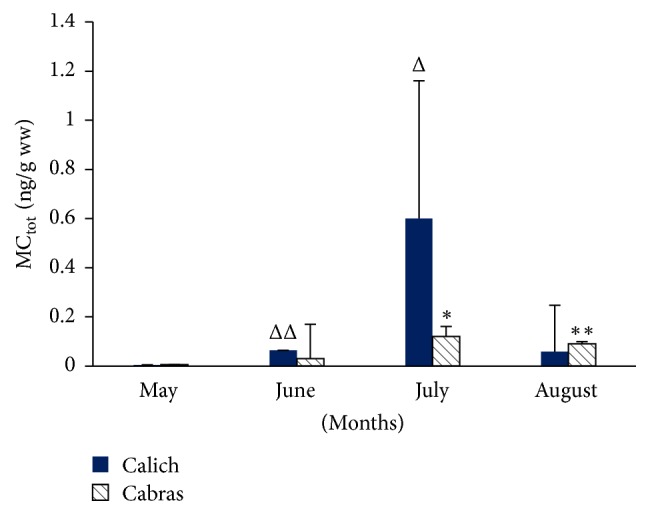
Figure 4.

ELISA results of MCs levels in mussels in Calich and Cabras lagoons. Data are expressed as mean ± SE. Asterisks indicate statistical differences in respect to May and June for Cabras (∗p < 0.05; ∗∗p < 0.001) and triangles indicate statistical differences in respect to May and August for Calich (Δ < 0.05; ΔΔ < 0.001).
