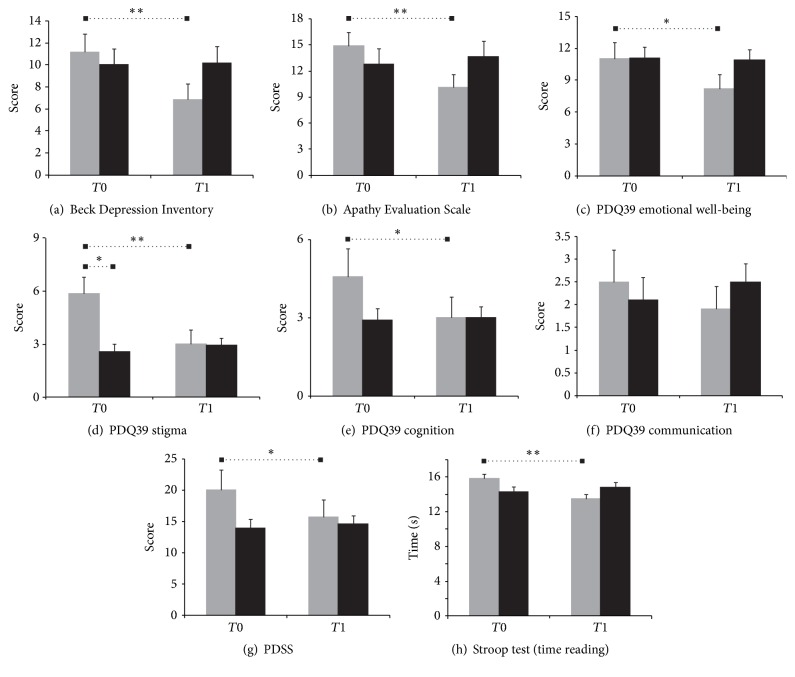
Figure 1.
Mean scores and standard error of the means at the two time points for the theatre (gray bars) and control group (black bars) in the scales or subscales showing a significant effect at the mixed-design ANOVAs (see text and Table 5 for more details). Bars indicate significant differences after post hoc analyses, the single ∗ indicates values of p < 0.01, and the double ∗ indicates values of p < 0.001. PDQ39: Parkinson's Disease Quality of Life Scale; PDSS: Parkinson's Disease Sleep Scale.

