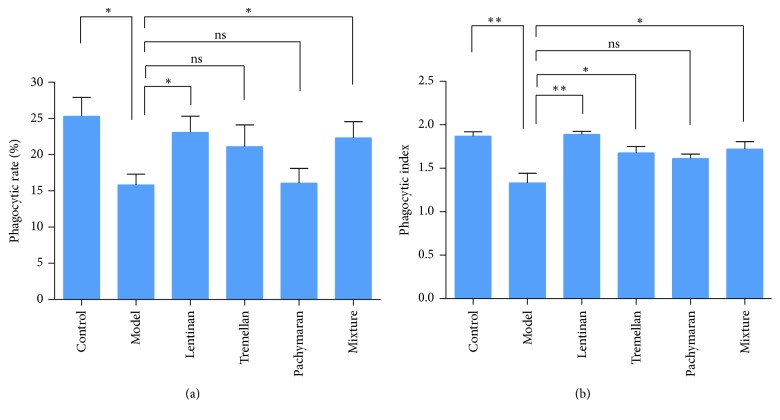
Figure 3.
The phagocytosis of macrophages. (a) The phagocytic rate was determined by counting the number of macrophages phagocytosing florescent microspheres in a population of 100 macrophages. (b) The phagocytic index was determined by counting the number of phagocytosed florescent microspheres per 100 macrophages. The results represented means ± SEM (n = 4). ∗P < 0.05, ∗∗P < 0.01, and ns: no significant difference.

