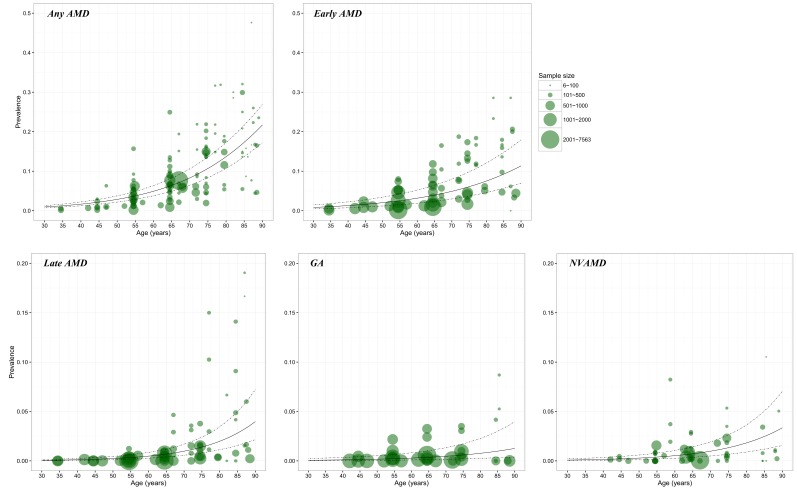
Figure 3.
Prevalence of age–related macular degeneration (AMD) and its subtypes by age in retained studies. Note: The size of each bubble is proportional to the sample size. There were 124 data points for constructing the relation between prevalence and age for any AMD, 67 for early AMD, 67 for late AMD, 35 for geographic atrophy (GA) and 54 for neovascular AMD (NVAMD).

