
Fig. 7.
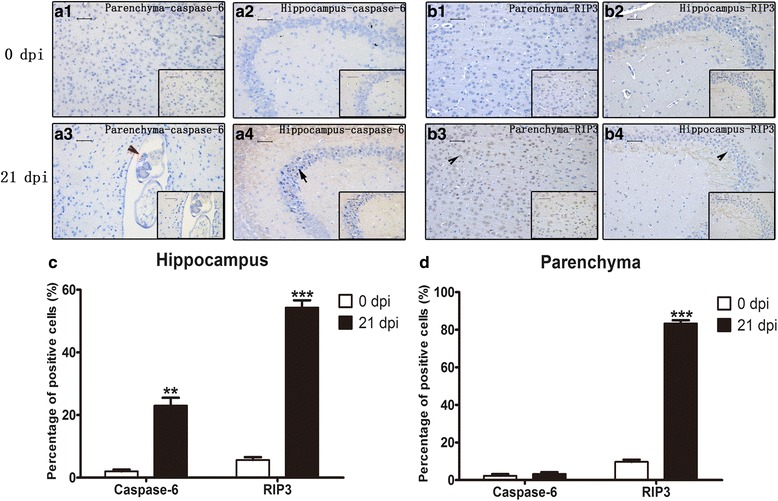
IHC staining of parenchymal and hippocampal cells in 0 dpi and 21 dpi groups to visualize the expression and localization of caspase-6 and RIP3. a1 Parenchymal caspase-6 expression in the 0 dpi group. a2 Hippocampal caspase-6 expression in the 0 dpi group. a3 Parenchymal caspase-6 expression in the 21 dpi group. a4 Hippocampal caspase-6 expression in the 21 dpi group. b1 Parenchymal RIP3 expression in the 0 dpi group. b2 Hippocampal RIP3 expression in the 0 dpi group. b3 Parenchymal RIP3 expression in the 21 dpi group. b4 Hippocampal RIP3 expression in the 21 dpi group. Black arrowhead indicates caspase-6-positive cells; arrow indicates RIP3-positive cells; red arrowhead indicates the worms in parenchyma of the mouse brain (magnification: 200×; insets: 400×). c Percentage of caspase-6- and RIP3-positive cells in the hippocampus. d Percentage of caspase-6- and RIP3-positive cells in parenchyma. Scale-bars: 50 μm; insets: 50 μm