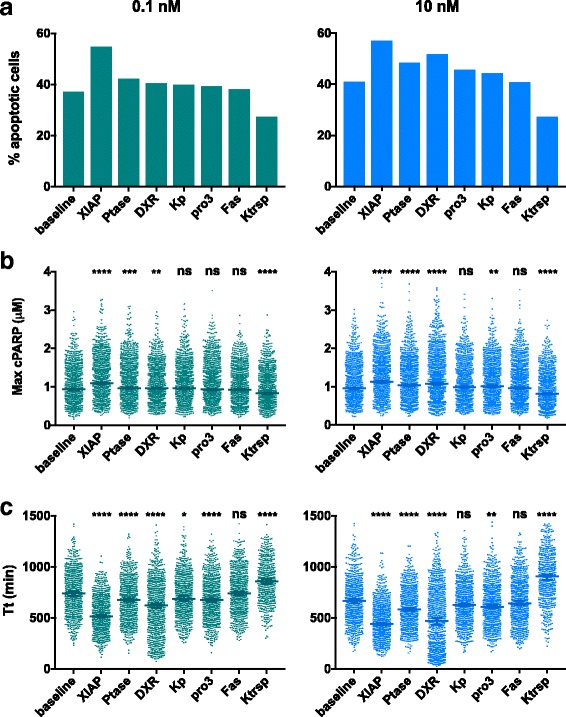
Fig. 5.

Predicted population-based response to TSP1 stimulation. Comparison of three quantities that characterize the population-level response: (a) the percentage of cells that have reached the cPARP threshold by 24 h, (b) the maximum cPARP level reached in each cell, and (c) the time to reach threshold (T t). Asterisks in panels (b) and (c) indicates the p-value from ANOVA: ****, p < 0.0001; ***, p < 0.001; **, p < 0.01; *, p < 0.1; ns, not significant
