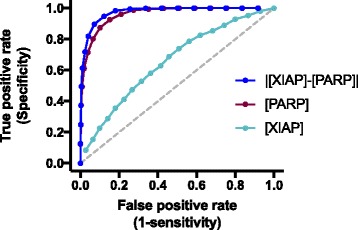
Fig. 7.

ROC curves for classifying the apoptotic response. Blue: ROC curve for the difference between the initial concentration of PARP and XIAP input; AUC is 0.97. Purple: ROC curve for the initial PARP concentration input; AUC is 0.95. Cyan: ROC curve for the initial XIAP concentration input; AUC is 0.65. All of three AUC values are significantly different than 0.5 (given by the gray dashed line, p < 0.0001), indicating that these inputs are reliable predictors of the cells’ response to TSP1 stimulation
