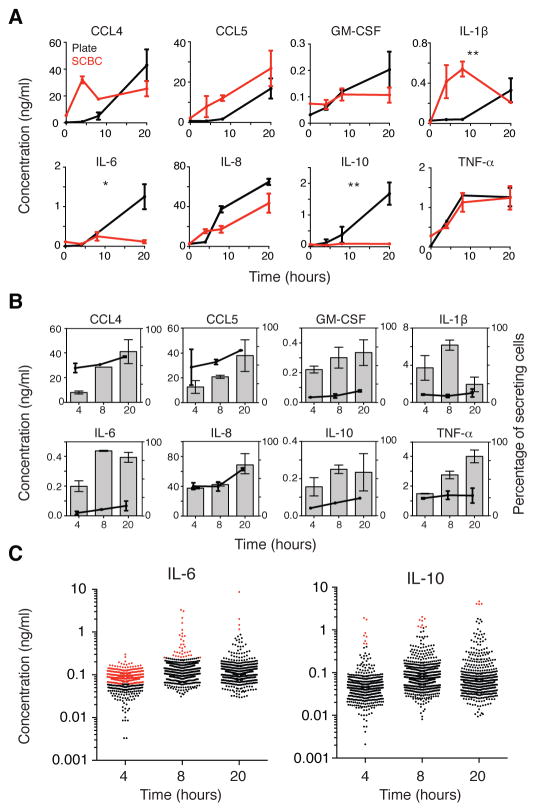
Fig. 2. Isolated single cells show altered cytokine secretion patterns over time as compared to those of cells in a population.
(A) Comparison of the concentrations of the indicated proteins secreted by cells in a population (black) and the average concentration of secreted proteins of all single cells cultured in the SCBC (red) in response to treatment with LPS for the indicated times. Fluorescence intensities for the secreted proteins were converted to concentrations as described earlier and include all cells above the detection threshold (DT) even if they were below the BT (as in fig. S4). Time courses were compared by two-factor analysis of variance (ANOVA). *P < 0.05. **P < 0.01. (B) Average concentrations of the indicated proteins secreted by secreting cells (that is, cells with intensities above the BT; bars, left axis) and the percentages of secreting cells (circles, right axis). Data in (A) and (B) are means ± SEM of at least two independent SCBC or cell population experiments. (C) Concentrations of IL-6 (left) and IL-10 (right) secreted by single U937 cells at 4 (n = 587 cells), 8 (n = 812), and 20 hours (n = 601) after stimulation with LPS. Cells that secreted cytokines at concentrations above those detected in the cultured cell population are indicated in red. Data are from one experiment that is representative of at least two independent experiments.

