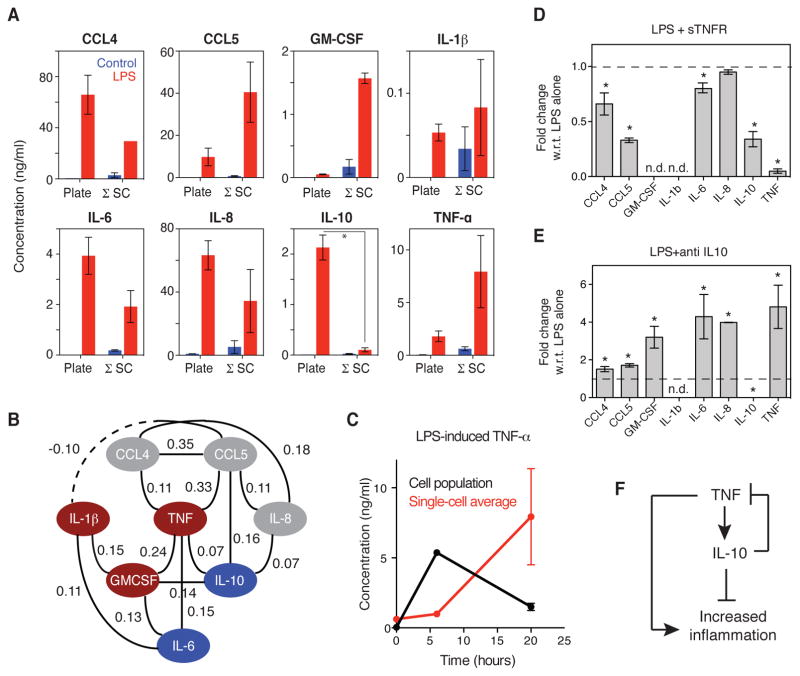
Fig. 6. Decreased secretion of IL-10 by isolated primary human MDMs is coupled to increased secretion of TNF-α and other inflammatory cytokines.
(A) Comparison of the concentrations of the indicated secreted proteins 20 hours after incubation with vehicle (blue) or LPS (red) for cells in a population (left) and in the SCBC (right). Single-cell secretion intensities were converted to concentrations based on recombinant protein standard curves as described earlier (fig. S3 and the Materials and Methods). Secreted cytokine concentrations for the cell population were measured by ELISA. Data are means ± SEM for two independent experiments for both the SCBC (n = 1331 cells) and population experiments. *P < 0.05 by t test. (B) GGM of the LPS-induced signaling network in MDMs inferred from data from single-cell experiments. Edges were included if P < 0.05. Cytokines are colored as described for Fig. 3B. (C) Comparison of the concentration of TNF-α secreted by the cell population (black) and the average concentration of TNF-α secreted by single cells cultured in the SCBC (red) at 0, 6, and 20 hours after stimulation with LPS. (D and E) Fold-changes in the LPS-stimulated secretion of the indicated cytokines after 20 hours of incubation in the context of blocking (D) TNF-α or (E) IL-10 signaling. The amounts of the cytokines secreted were measured by Bio-plex and are means ± SEM of three biological replicates. *P < 0.05 by t test compared to cells treated with LPS alone. (F) Network diagram of an I1-FFL formed by TNF-α and IL-10 (see Discussion).

