
Figure 3.
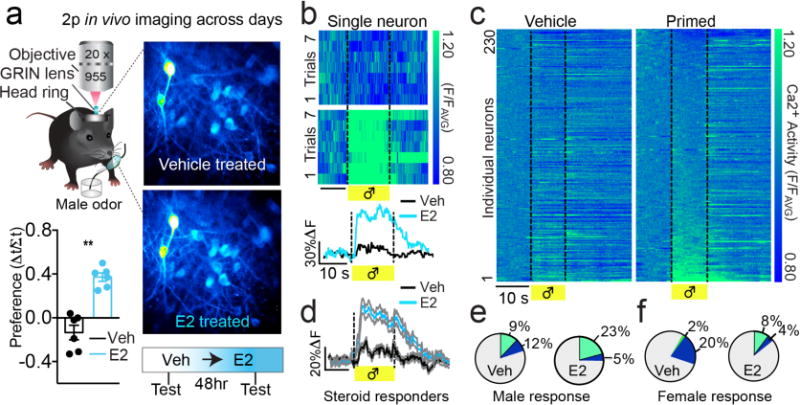
mPOANts neurons encode reproductive male cues in a steroid-gated manner. (a) Top: schematic illustrating chronic Ca2+ imaging in mPOANts::GCaMP6 cells on separate hormone-treated days. Bottom: ovariectomized females had a higher behavioral preference for male urine following estradiol (blue) compared to vehicle (black) (error bars, ± s.e.m., paired t-test, t5 = 5.85, P = 0.0021, n = 6 mice). (b) Top: each row of the heat plot represents the Ca2+ response during each male odor trial from an individual mPOANts::GCaMP6 cell imaged across treatment days. Vertical axis: normalized Ca2+ fluorescence (F/FAVG). Scale bar, 10 s. Bottom: Ca2+ traces from the same neuron averaged across the 7 male odor trials. Scale bar: x, 10 s; y, 30% ÆF/F. Veh, vehicle oil; E2, estradiol. (c) Each row of the heat plot depicts the Ca2+ response of an individual mPOANts::GCaMP6 cell averaged across male odor trials and imaged after vehicle (left plot) or estradiol (right plot). Heat plots are indexed in the same order for comparison and cells were sorted by male odor response following estradiol replacement. Scale bar, 10 s (n = 230 cells combined across 4 mice). (d) Averaged Ca2+ traces from mPOANts::GCaMP6 cells significantly excited by male odor after estradiol compared to their response after vehicle. Scale bar: x, 10 s; y, 20% ÆF/F (gray shading represents ± s.e.m., paired t-test, t49 = 8.98, P < 0.0001, n = 51 cells combined across 4 mice). (e) Pie charts represent the percent of cells significantly excited (green) or inhibited (blue) by male odor by treatment (Wilcoxon t-test, all P < 0.05, n = 230 cells combined across 4 mice). (f) Pie charts represent the percent of cells significantly excited (green) or inhibited (blue) by female odor by treatment (Wilcoxon t-test, all P < 0.05, n = 230 cells combined across 4 mice).