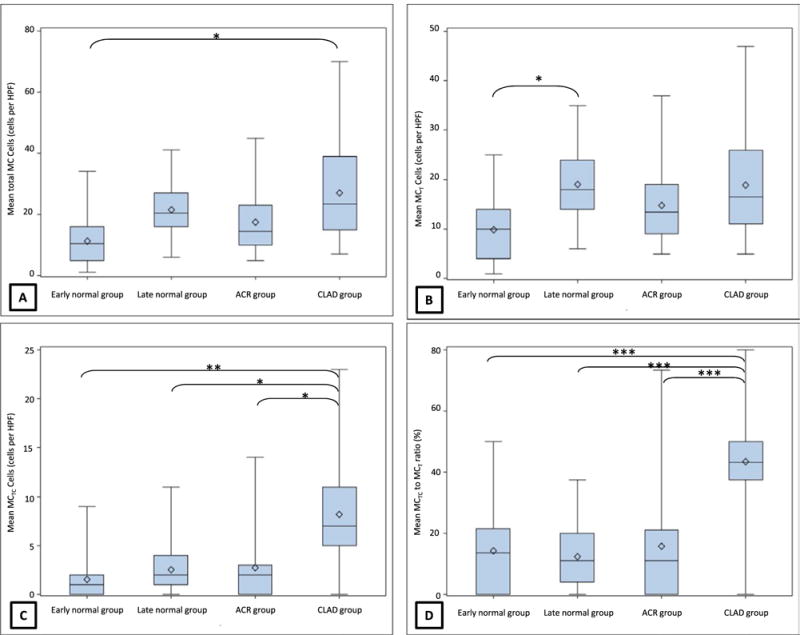
FIGURE 3.

(A) Box plot of total MC among the four groups; intergroup difference between early normal group and CLAD group was statistically significant (*P<.05); (B) Box plot of MCT among the four groups; intergroup difference between early normal group and late normal group was statistically significant (*P<.05); (C) Box plot of MCTC among the four groups; intergroup difference between CLAD group and all other groups was statistically significant (*P<.05, **P<.01); (D) Box plot of ratio of MCTC to MCT among the four groups; intergroup difference between CLAD group and all other groups was statistically significant (***P<.001). ACR, acute cellular rejection; CLAD, chronic lung allograft dysfunction.
