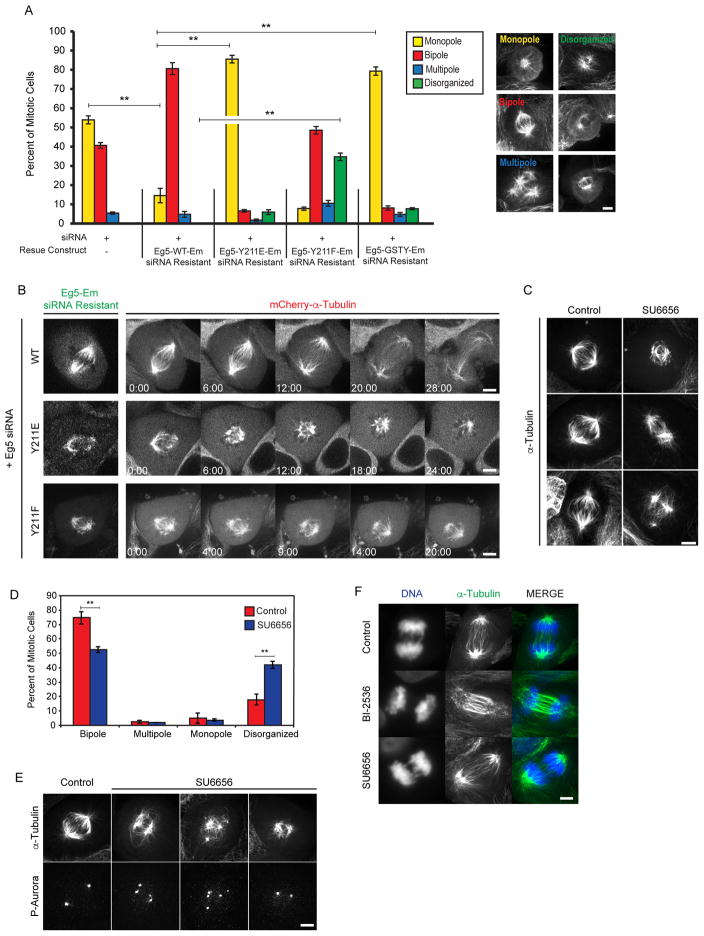
Figure 3. Mitotic spindle defects in cells expressing phosphomimetic and non-phosphorylatable mutants of Eg5.
A. Percent of mitotic phenotypes in LLC-Pk1 cells transfected with siRNA targeting endogenous Eg5 alone or co-transfected with an siRNA resistant Eg5 Emerald construct (WT, Y211E, Y211F, GSTY). Monopole (yellow), bipole (red), muitipole (blue), disorganized (green). Examples of each phenotype are shown on right. B. Time-lapse imaging of LLC-Pk1 cells expressing mCherry-α-tubulin (right panels) co-transfected with Eg5 siRNA and siRNA resistant Eg5 Emerald constructs (WT, Y211E, and Y211F left panels). C. Immunofluorescence staining for MTs in control (left) and SU6656-treated (right) parental LLC-Pk1 cells. D. Quantification of mitotic spindle phenotypes shown in C. E. Immunofluorescence staining for MTs (top) and phospho-Aurora (bottom) for control and SU6656 treated cells. (F) Immunofluorescence staining of α-tubulin in anaphase LLC-Pk1 cells: control (top), BI-2536 (middle), SU6656 (bottom). ** = p ≤ 0.01. Scale bars in A, B, C, E, F = 5 μm. Time in B (min:sec). Error Bars = St Dev.

