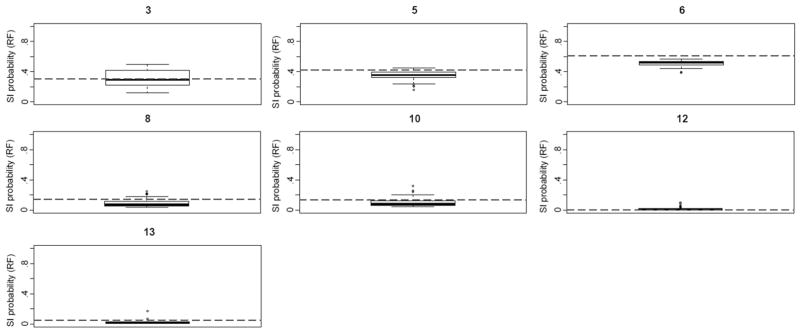
Figure 6.
Box plots comparing the classification tree results with the bootstrapped random forest results among women. Number above box plots indicates corresponding terminal node in the single classification tree (Figure 4). The dashed line indicates the probability of suicidal ideation (SI) from the single tree for individuals in that node. The bold line in the center of each box represents the median probablity of SI from the random forest for the same individuals. RF = random forest.

