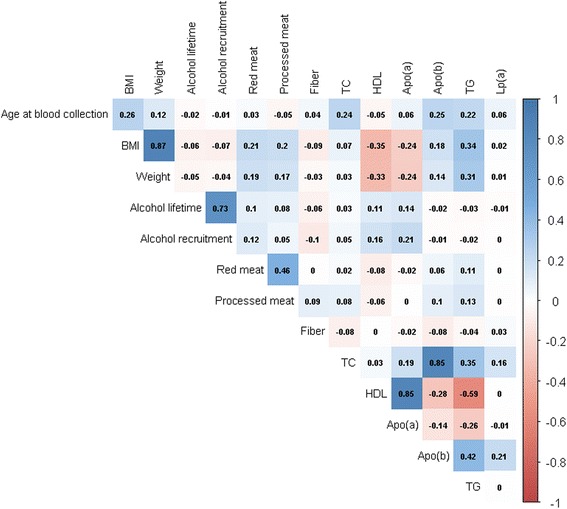
Fig. 1.

Correlation matrix of covariates with lipid biomarkers in the EPIC–Heidelberg subcohort (n = 2739). Red depicts negative correlation, blue depicts positive correlation; the darker the shade the stronger the correlation. apo apolipoprotein, HDL high-density lipoprotein, Lp(a) lipoprotein a, TC total cholesterol, TG triglycerides
