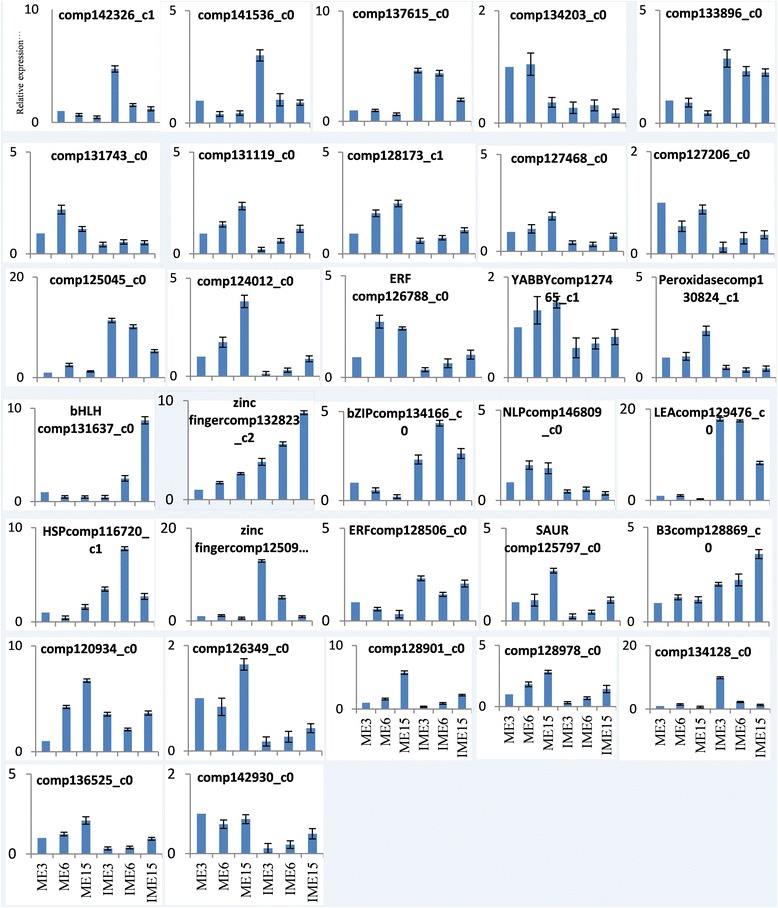
Fig. 10.

Relative mRNA levels of 32 DEGs in wheat callus were determined by quantitative RT-PCR analyses. Genes were normalized to the actin gene (GenBank: AB181991). Experiments were repeated in triplicate. Error bars represent one standard deviation (SD). Relative expression level of genes in IME were presented as fold-change (mean ± SD) compared according to ME of 1.0
