Fig. 2.

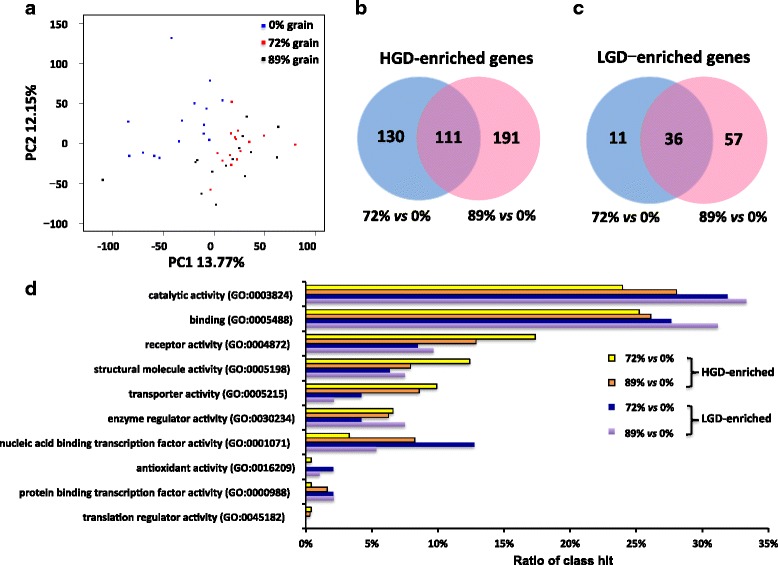
Transcriptomic differences between low grain diet (LGD, 0% grain) and high grain diet (HGD, 72% and 89% grain). a Principle component analysis of the total detected genes fed three diets. b Differentially expressed (DE) genes that enriched in HGD. c DE genes that enriched in LGD. d Functional classification of HGD enriched genes and LGD enriched genes
