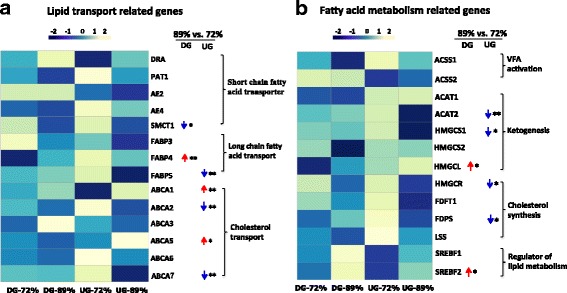
Fig. 5.

The patterns of lipid transport and fatty acid metabolism related genes expression during diet transition (from 72% to 89% grain) in DG and UG. a The pattern of lipid transport related genes expression. b The pattern of fatty acid metabolism related genes expression. The legend represents the RPM value scaled by rows, the blue means highly expressed in the 72% grain and yellow means highly expressed in the 89% grain. The data were analyzed by T-test, * indicated P < 0.1, ** indicated P < 0.05, and *** indicated P < 0.01. ↓ means decreased and ↑ means increased when the diet transitioned from 72% grain to 89% grain within each group
