Fig. 6.

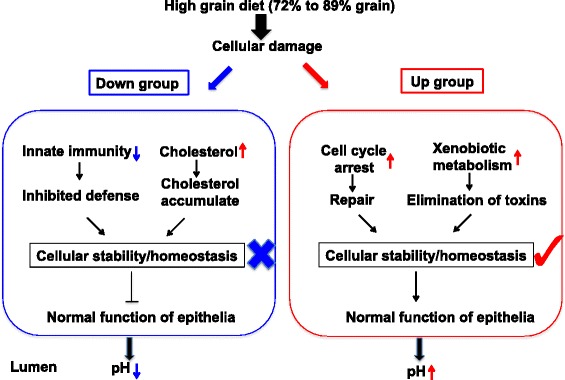
Illustrative comparison of the gene networks related to distinct adaptation between Down group and Up group. ↓ means decreased and ↑ means increased when the diet transitioned from 72% grain to 89% grain within each group

Illustrative comparison of the gene networks related to distinct adaptation between Down group and Up group. ↓ means decreased and ↑ means increased when the diet transitioned from 72% grain to 89% grain within each group