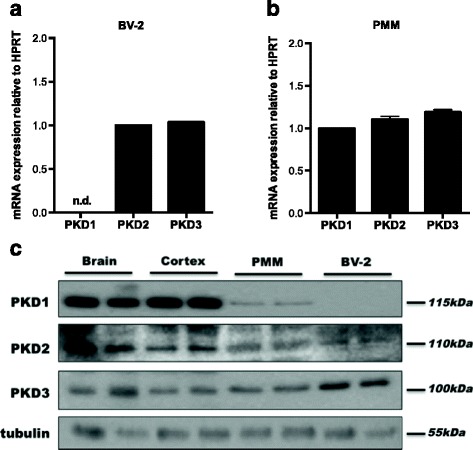
Fig. 1.

PKD isoform expression in BV-2 cells and PMM. Gene expression of PKD1–3 in a BV-2 and b PMM was analyzed by qPCR and normalized to HPRT. Values are expressed as mean + SD. PKD2 expression in BV-2 and PKD1 in PMM was arbitrarily set to 1. n.d. not detectable. c Protein expression of PKD isoforms was determined by western blotting. Samples from the whole brain and cortex were used as controls. One representative blot out of three is shown. β-Tubulin was used as loading control
