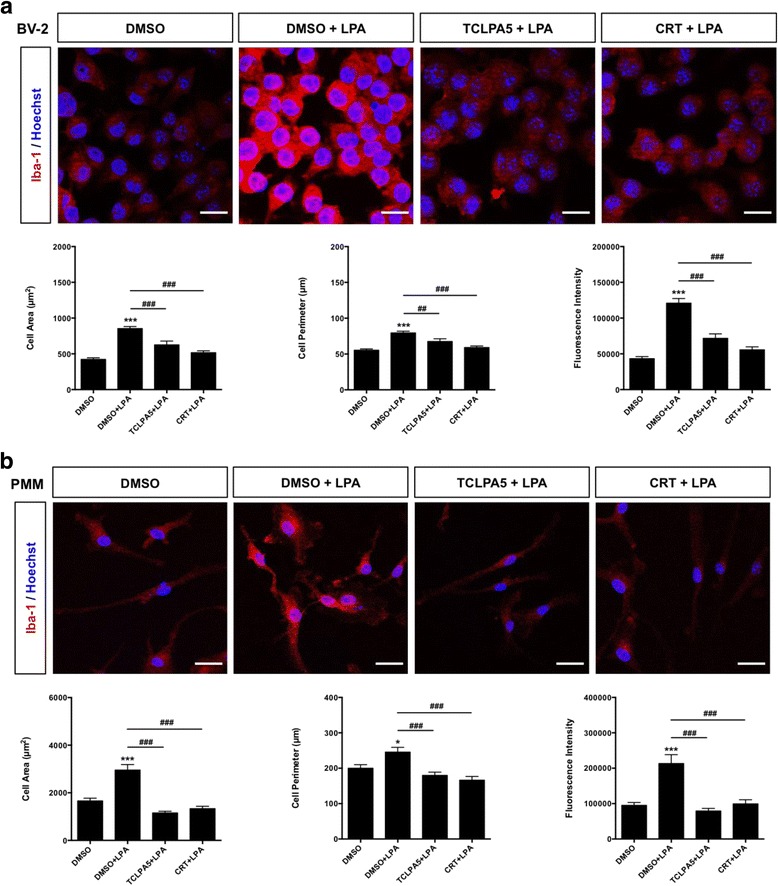
Fig. 9.

Inhibition of LPAR5 and PKD reverses the LPA-induced morphological changes in microglial cells. a BV-2 and b PMM were cultured on chamber slides, serum-starved overnight, and treated with DMSO, DMSO plus LPA (1 μM), and LPA (1 μM) plus TCLPA5 (5 μM) or CRT (1 μM) for 24 h. Cells were fixed, permeabilized, blocked, and incubated with rabbit anti-mouse Iba-1 antibody (1:100) and, subsequently, with Cy-3-labeled secondary goat anti-rabbit antibody (1:200). Images were acquired with a Leica confocal microscope. Morphological analysis and analysis of Iba-1 fluorescence intensity were performed using ImageJ. At least 50 cells out of three different areas per chamber were measured (two independent experiments), and quantitative results are shown as bar graphs below fluorescence images. The results are presented as mean + SEM (*p < 0.05, ***p < 0.001, compared to DMSO-treated cells; ## p < 0.01, ### p < 0.001, LPA plus TCLPA5 or CRT versus LPA only; unpaired Student’s t test). Scale bars = 20 μm
