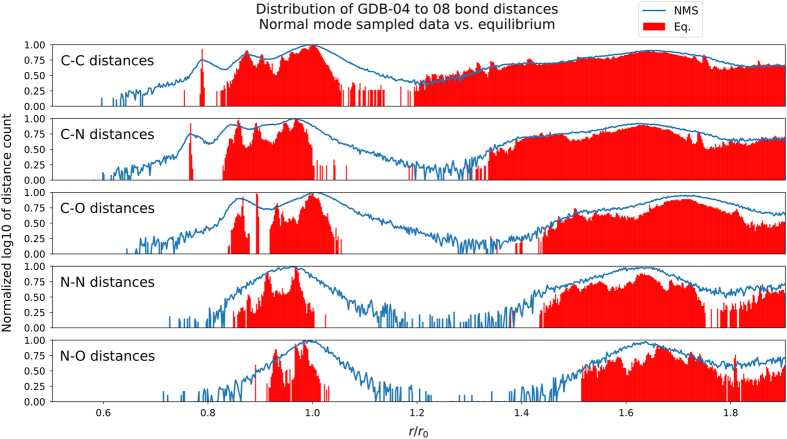
Figure 4. Distance distribution for dataset.
Distribution of atomic distances in the subset of the data set constructed from the molecules containing between 4 and 8 heavy atoms (GDB-04 to 08) of C, N, and O. The y-axis is the base 10 logarithm of the count of distances in each bin, normalized over the full domain so that the two sets can be compared. The x-axis represents the atomic distance (r) divided by the single bond equilibrium distance (r0) for the smallest possible molecule containing a single bond of the type shown, as calculated using the ωB97x density functional with the 6–31 g(d) basis set. The red histogram shows the full distribution of distances for a data set containing only equilibrium distances. The blue line shows the distribution of our non-equilibrium data set, with distances randomly sub sampled at a rate of 1%. As the figure shows, even 1% of the non-equilibrium data set covers vast areas of atomic distance space where the equilibrium data set fails to sample.

