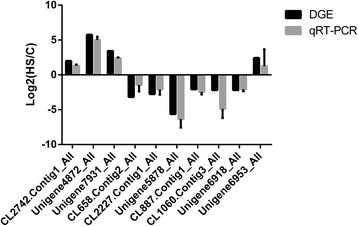
Fig. 8.

qRT-PCR analysis of the expression levels of ten unigenes. X axis represents different unigenes. CL2742.Contig1_All, cytochrome P450 9G3; Unigene4872_All, HSP 19.7; Unigene7931_All, HSP 16.1; CL658.Contig2_All, aldehyde dehydrogenase family of seven members A1; CL2227.Contig1_All, acetyltransferase 1; Unigene5878_All, hemolymph juvenile hormone-binding protein; CL887.Contig1_All, aldose 1-epimerase-like; CL1060.Contig3_All, 17-beta-hydroxysteroid dehydrogenase; Unigene6918_All, Hematopoietically-expressed homeobox protein HHEX homolog; Unigene6953_All, cytochrome P450 B5. Y axis represents the relative expression levels of genes. Ribosomal protein L32 (Rpl32) was used as an internal control
