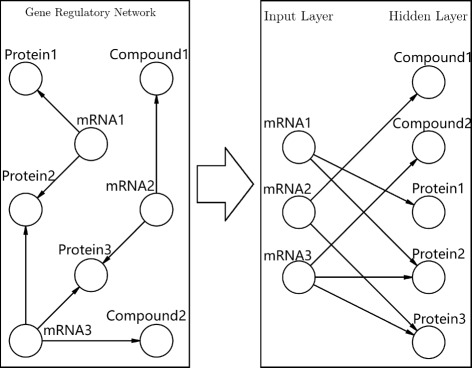
Fig. 1.

Figure illustrates the conversion of a gene regulator network (GRN) into an artificial neural network (ANN). The left panel shows regulatory interactions between genes and their upstream regulators (e.g., Proteins, Compounds, etc.). The panel on the right side represents the input and the hidden layer of the induced ANN based on the gene regulatory interactions. Each mRNA-regulator interaction in the GRN correspond to a input-hidden node connection in the ANN
