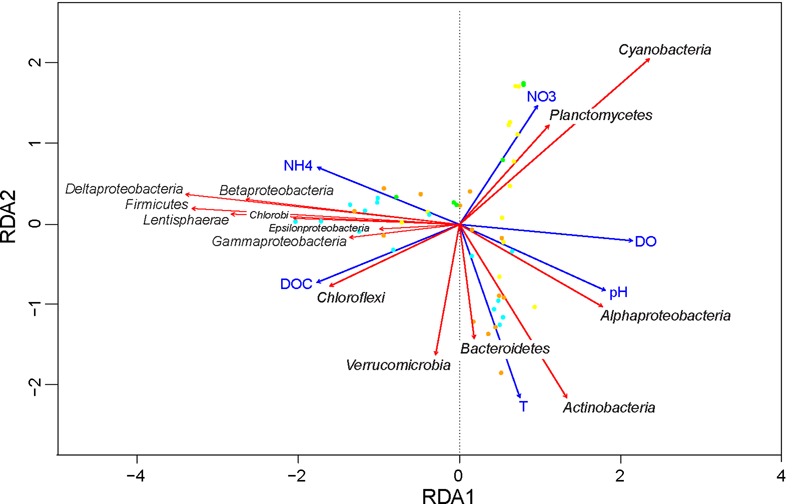
FIGURE 7.

Redundancy analysis of the effect of environmental variables on bacterial community composition. Taxonomic responses (red arrows) are shown at the class level for Proteobacteria and at the phylum level for all other bacteria. Only taxa with a total average abundance above 0.1% are shown. All explanatory variables (blue arrows) in this triplot are significant (Table 2). Symbols represent the sampling points (yellow = spring; orange = summer; cyan = fall; green = winter). Total variation explained by the RDA model was 48%.
