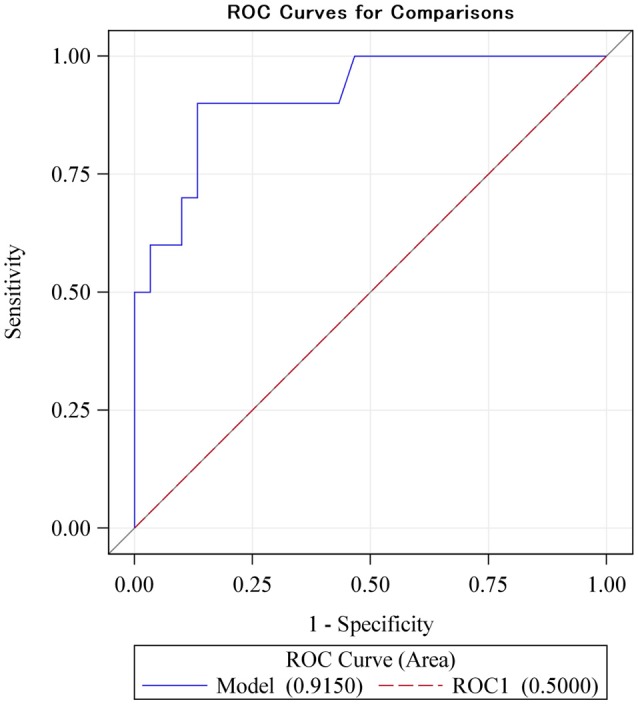
Figure 3.

The ROC sensitivity curve of the main explanatory variable (difference between monomodal and bimodal gamma steady-state response) as a predictor of low intelligence scores (defined as lower than two-thirds of a standard deviation below the mean). With a cut-off value for ΔCA of 0.25 the sensitivity for prediction of low memory is as high as 0.9 and the specificity is as high as 0.87 (Youden-index: 0.77). The ROC sensitivity is 92% (CI: 0.81–1.00).
