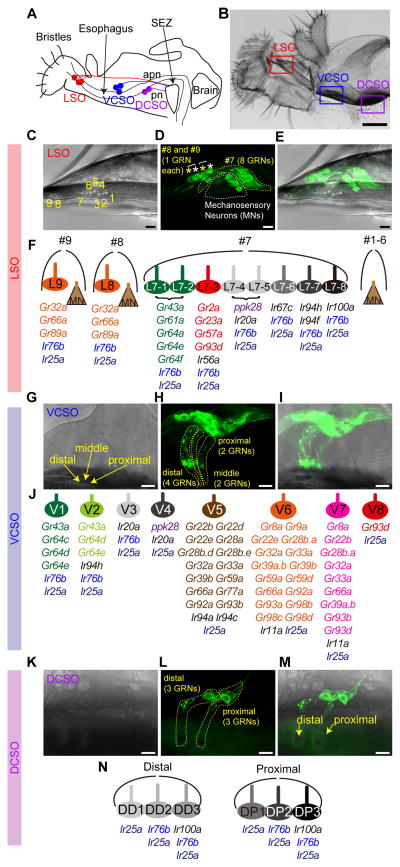
Figure 1. Receptor-to-neuron maps of three pharyngeal taste organs.
Schematic (A) and bright field image of proboscis (B) and three pharyngeal taste organs in wild type flies. Taste neurons from the LSO and VCSO project to the subesophageal zone (SEZ) via the accessory pharyngeal nerve (apn); DCSO neurons project via the pharyngeal nerve (pn). Scale bar: 100 μm (C–E) MJ94-GAL4 driven UAS-mCD8-GFP labeled neurons in LSO. Numbers in (C) indicate the nine LSO sensilla with a linear organization. In (D) white dotted line and asterisks indicate mechanosensory neurons; yellow dotted line and asterisks indicate gustatory receptor neurons (GRNs). Scale bar: 10 μm. (F) Schematic summary of a receptor-to-neuron map of the LSO as defined by reporter gene expression. MN, Mechanosensory neurons. (G–I) Ir25a-GAL4 driven UAS-mCD8-GFP labeled neurons in the VCSO. Yellow arrows mark three VCSO chemosensory sensilla with non-linear organization, which precluded sensillar assignment of individual neurons in the following mapping analysis. Yellow dotted lines delineate groups of GFP labeled neurons in each sensillum. Note that these representative images are the same as shown in Fig. 3A. Scale bar: 10 μm. (J) Schematic summary of a receptor-to-neuron map of the VCSO as defined by reporter gene expression. (K–M) MJ94-GAL4 driven UAS-mCD8-GFP labeled neurons in the DCSO. Yellow arrows mark two DCSO chemosensory sensilla. Yellow dotted lines delineate groups of GFP labeled neurons in each sensillum. Scale bar: 10 μm. (N) Schematic summary of a receptor-to-neuron map of the DCSO as defined by reporter gene expression.

