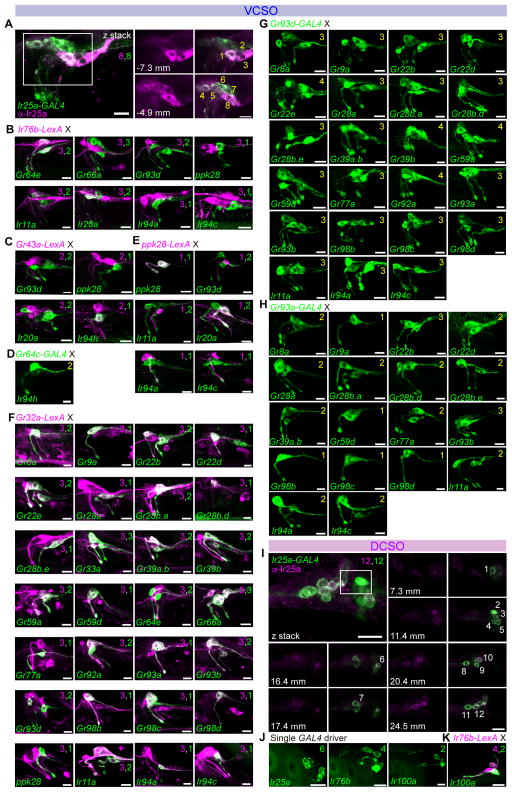
Figure 3. Chemoreceptor-GAL4/LexA reporter mapping in ventral and dorsal cibarial sense organs (VCSO/DCSO).
(A–H) GFP expression (green) driven by indicated Gr-GAL4 and Ir-GAL4 lines in the VCSO co-stained with anti-Ir25a antibody (magenta) (A); tested in combination with LexAop2-mCherry-HA (magenta) in co-labeling experiments with Ir76b-LexA (B), Gr43a-LexA (C), ppk28-LexA (E), and Gr32a-LexA (F); and in double-driver experiments with indicated GAL4 driver (D, G, H). Numbers in panels in (A) are used to label different cells visualized in different optical planes; positions along the z-axis are indicated in μm for the extracted slices. See also Supplemental movie 3. Numbers in top right corners indicate total numbers of green or magenta cells labeled with corresponding GAL4/LexA reporters. Numbers in yellow in the top right corners in panels (D), (G) and (H) indicate total numbers of GFP+ cells observed with double GAL4 driver analysis.
(I) GFP expression (green) driven by Ir25-GAL4 in the DCSO co-stained with anti-Ir25a antibody (magenta). Numbers in panels are used to label different cells visualized in different optical planes; positions along the z-axis are indicated in μm for the extracted slices. See also Supplemental movie 4. Scale bar: 10 μm.
(J–K) GFP expression (green) driven by indicated Ir-GAL4 lines in the DCSO (J) or tested in combination with LexAop2-mCherry-HA (magenta) in co-labeling experiments with Ir76b-LexA (K). Numbers in the top right corners indicate total numbers of green and magenta cells labeled by corresponding GAL4/LexA reporters. See also Figure S1.
All panels show compressed z-stacks, with the exception of those labeled with μm in (A and I), which represent single optical slices. Scale bar: 10 μm.

