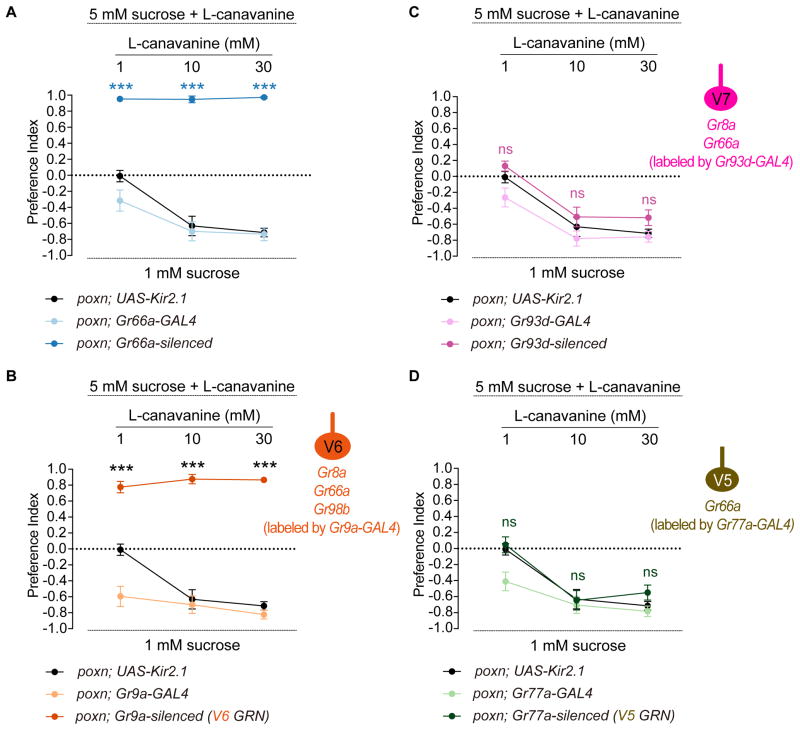
Figure 6. Genetic silencing experiments support receptor-to-neuron maps.
Mean preference index values from binary choice experiments with sucrose tested against a mixture of sucrose and L-canavanine at indicated concentrations. All genetics manipulations with Gr66a-GAL4 (A), Gr9a-GAL4 (B), Gr93d-GAL4 (C), and Gr77a-GAL4 (D) were performed in a poxn mutant background (poxnΔM22-B5/poxn70). Schematics of identified VCSO neurons derived from Figure 3 indicating expression of Gr8a-/Gr66a-/Gr98b-GAL4 are shown on the right of Figure 6B, C, D. n=10–30. Error bars = SEM. ***P < 0.0001 versus UAS control, two-way ANOVA with post-hoc Tukey test. ns, not significant.

