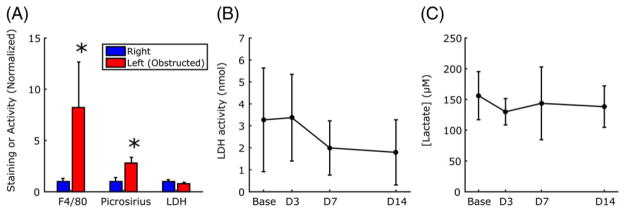
FIGURE 5.
Quantitative comparison of immunohistological and biochemical assay results. Significantly greater intensity of staining was found in the left kidney relative to the right for both F4/80 and picrosirius red, although the activity of lactate dehydrogenase (LDH) in the kidneys was not different (A). LDH activity in the serum (B) and lactate concentration in the urine (C) showed no significant changes across time points. In (A), data are normalized to the value of the right kidney. Data are plotted as mean ± standard deviation. *p ≤ 0.05 between left and right kidneys

