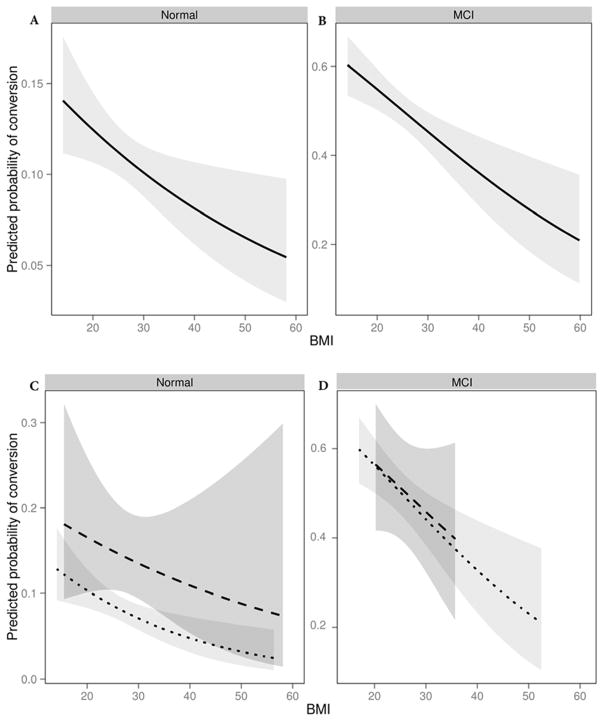
Figure 2.
Panel A displays the predicted probability of diagnostic conversion for NC over the spectrum of BMI (kg/m2), showing a decreasing probability of conversion with higher baseline BMI. Panel B displays the corresponding predicted probability of conversion for MCI, showing a similar pattern but with overall greater probability of conversion at every BMI value. Panels C and D display the predicted probability of conversion stratified by the presence or absence of significant weight in the 12 months preceding outcome measure (dotted line representing absence of significant weight loss, dashed line representing significant weight loss). For all panels, data are fitted for a given participant profile (using prevalent level for categorical covariates and median for continuous covariates), including age (75), years of education (16), race (White), sex (female), total years in study (3), modified FSRP (12). Shading reflects 95% confidence interval.

