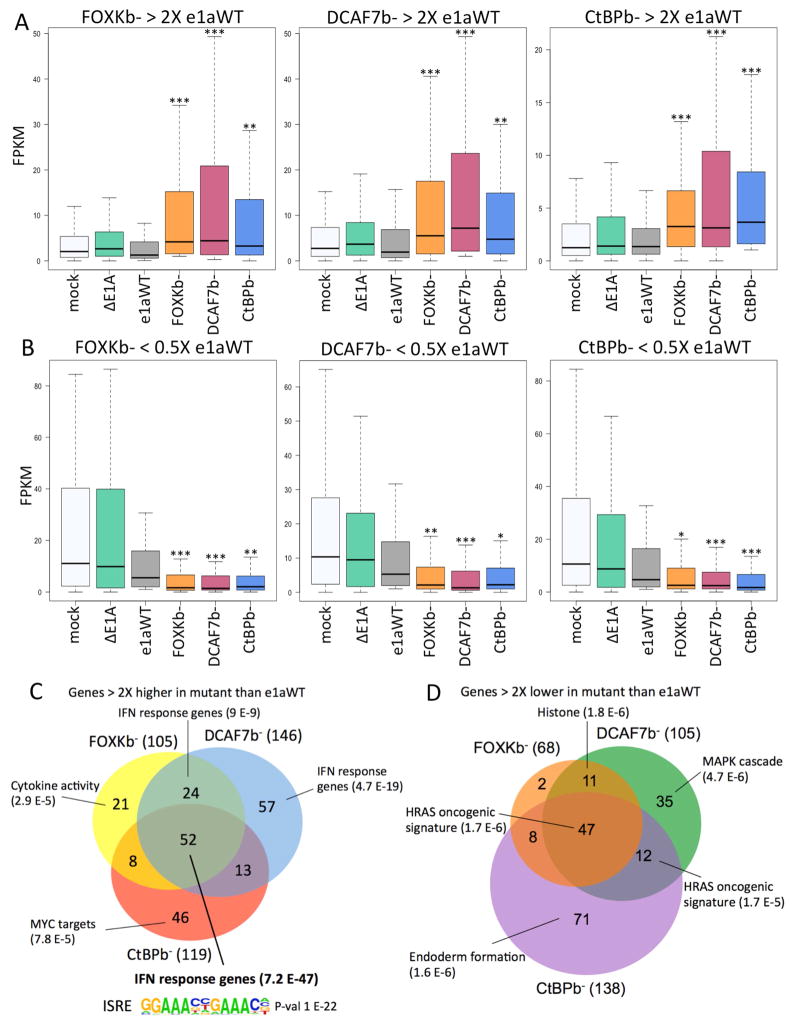
Figure 3. Genes Differentially Expressed by e1a C-terminal Mutants.
(A) Distributions of FPKMs plotted as boxplots for the genes expressed 2-fold higher by HBTEC expressing FOXKb− (left, 105 genes), DCAF7b− (middle, 146 genes) or CtBPb− (right, 119 genes) compared to e1aWT.
(B) Distributions of FPKM values for genes expressed 2-fold lower by HBTECs expressing FOXKb− (68 genes, left), DCAF7b− (105 genes, middle) or CtBPb− (138 genes, right) compared to e1aWT. (A,B) * p<0.005, ** p<0.001, *** p<0.0001 Kolmogorov-Smirnov test for significant differences from the distribution in e1aWT expressing HBTECs.
(C–D) Venn diagrams showing overlap and gene ontologies, with p values shown in parentheses, for genes expressed 2-fold higher (C) or 2-fold lower (D) by each e1a mutant compared to e1aWT. The ISRE motif enriched in promoters of genes expressed 2-fold higher by all three e1a mutants is shown in (C).

