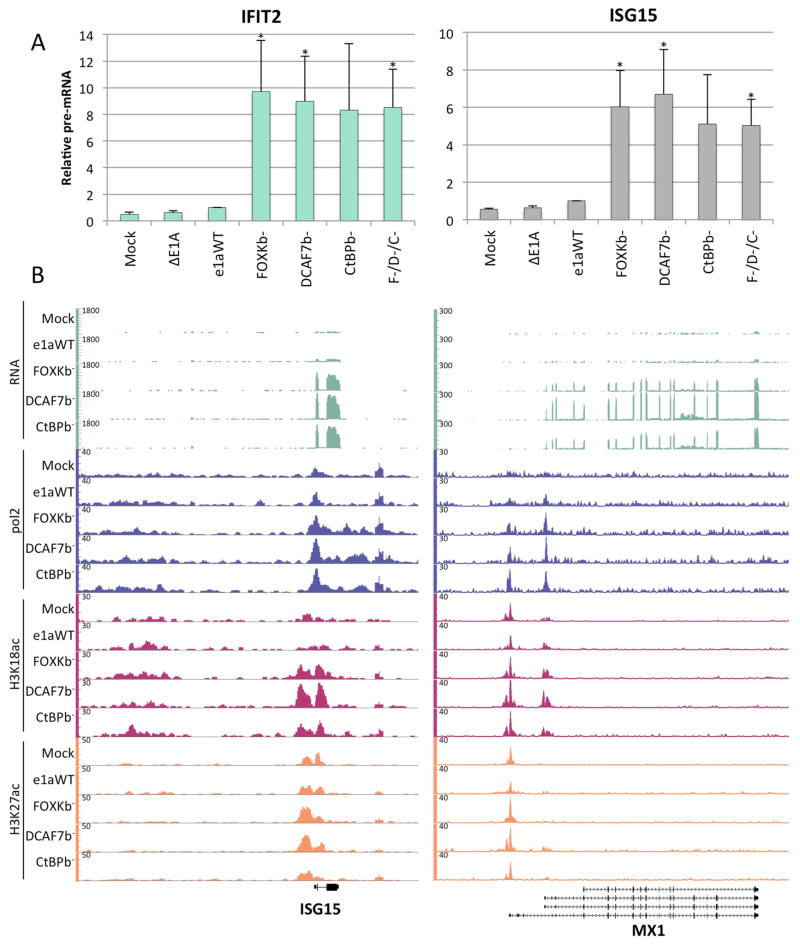
Figure 5. Transcriptional Activation of ISGs by e1a C-terminal Mutants.
(A) Relative levels of IFIT2 and ISG15 pre-mRNAs following infection with the indicated vectors or coinfection with the vectors for each of the three e1a C-terminal mutants (F−/D−/C−). Data are represented as averages of three separate experiments + S.D. * p<0.05 compared to WT e1a.
(B) Genome browser plots of RNA- or ChIP-seq normalized sequence tags.

