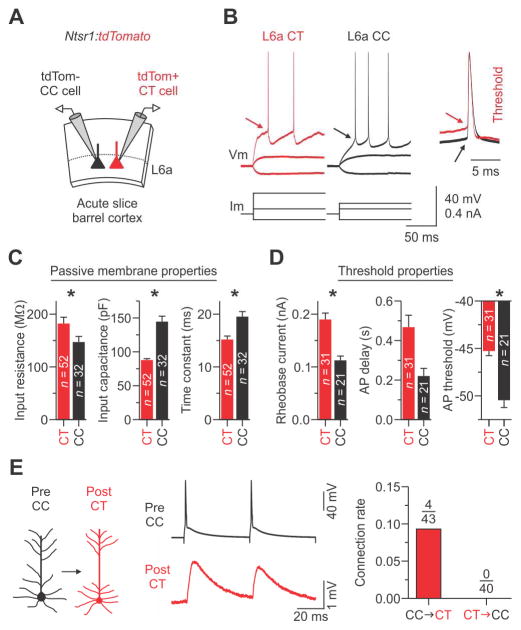
Figure 4. Intrinsic physiological properties of CT and CC cells in L6a.
(A) Schematic of the slice recording configuration. L6a CT cells were identified by Cre-dependent tdTomato expression while CC cells were identified as tdTomato-negative and physiologically as regular-spiking (see Figure S3–S5).
(B) Voltage responses to injected current of representative CT and CC cells. Evoked action potentials (APs) required more current to reach threshold (arrow, inset) in CT cells than in CC cells.
(C and D) Histograms showing the mean ± s.e.m. for key passive properties (C) and AP threshold properties (D). Asterisks indicate statistical significance. See Table S1 for summary statistics for all intrinsic properties.
(E) (Left and middle) Unitary EPSPs in a CT cell evoked by APs in a CC (trace represents the average of 15 trials, train of two APs at 20 Hz; holding potentials for both cells were −84 mV). (Right) Summary graph of the connection rate between CT and CC neurons. In total, we found 0 CT-to-CC connections (0.0%; n = 40 pairs tested in 23 mice) and 4 CC-to-CT connections (9.3%; n = 43 pairs tested in 24 mice) with mean unitary EPSP amplitudes of 0.7 ± 0.2 mV on the first AP (see Figure S8).
Summary statistics (Input resistance: CT cells = 182.2 ± 12.0 MΩ; CC cells = 147.1 ± 10.7 MΩ; n = 52/32 CT/CC cells from 24/20 mice, p = 0.0348, two-tailed Mann-Whitney U-test; Input capacitance: CT cells = 87.9 ± 2.1 pF; CC cells = 144.6 ± 8.0 pF; n = 52/32 cells from 24/20 mice, p = 6.44 × 10⁻¹¹, two-tailed Mann-Whitney U-test; Time constant: CT cells = 15.2 ± 0.7 ms; CC cells = 19.5 ± 1.0 ms; n = 52/32 cells from 24/20 mice, p = 5.22 × 10⁻⁵, two-tailed Mann-Whitney U-test; Rheobase current: CT cells = 190.0 ± 12.2 pA; CC cells = 112.4 ± 8.2 pA; n = 31/21 cells from 16/12 mice, p = 1.64 × 10⁻⁵, two-tailed t-test; AP delay: CT cells = 468.0 ± 60.0 ms; CC cells = 220.6 ± 38.7 ms; n = 31/21 cells from 16/12 mice, p = 0.05187, two-tailed Mann-Whitney U-test; AP threshold: CT cells = −45.3 ± 0.5 mV; CC cells = −50.5 ± 0.8 mV; n = 31/21 cells from 16/12 mice, p = 2.18 × 10⁻⁷, two-tailed t-test). Data are represented as mean ± SEM. See also Figure S3–S5 and S8; Table S1 and S2.

