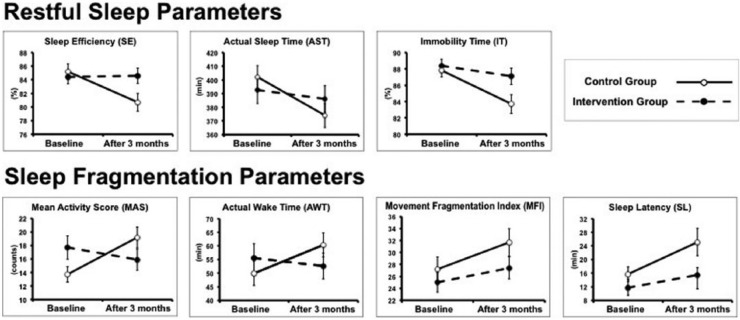
Figure 1.
Visual appreciation of the trajectories of the sleep parameters in the IG and CG from PRE (baseline conditions) to POST (after 3 months). Three out of 7 parameters (ie, SE, AST, IT) are representative of Restful Sleep (the higher the parameter, the better). The other 4 parameters (ie, MAS, AWT, MFI, SL) are representative of Fragmented Sleep (the lower the parameter, the better). The presence of an interaction between group and time is visualized as 2 nonparallel lines (one line per group) connecting the levels of the sleep parameter measured at the 2 time points (PRE and POST). For the statistical analysis, refer to the text.

